Our philosophy is to interpret and weave your research or data into an interesting and engaging narrative which is easier to comprehend. It is not just about creating a pretty picture, it is about crafting a dynamic and stimulating visual which fits in the context, which creates an impact on the audience and provokes to dig deeper into the research.To enable us to do so, we work along with you to come up with the best possible concepts and solutions.To give you a better understanding of how we work, here is a brief description of our process.
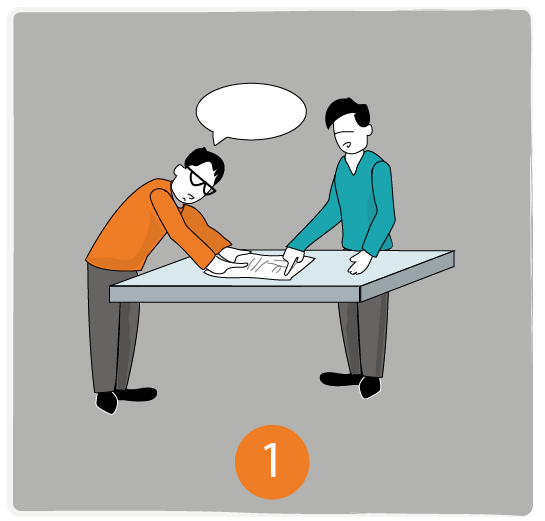
1. You have awesome data you want to represent visually, and you tell us about it.
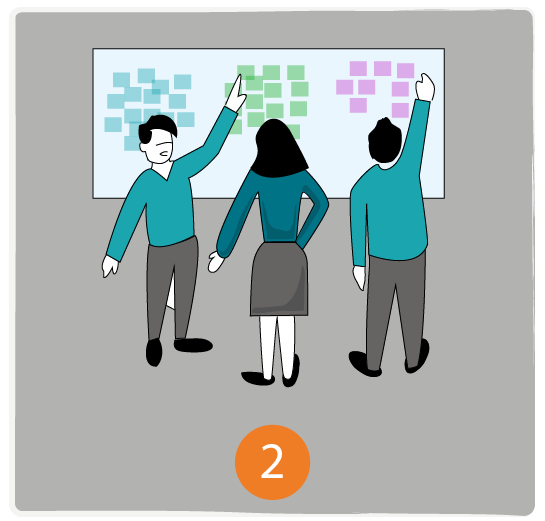
2. We brainstorm and come up with two awesome concepts which do justice to your data.

3. You choose one of our concepts after we brief you about them.
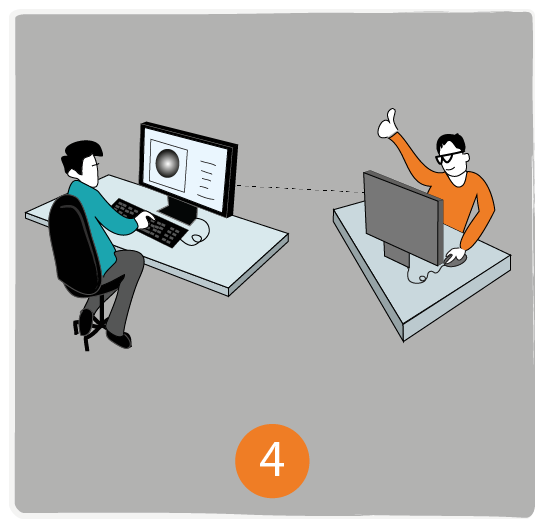
4. We refine and finish the chosen concept, ready to be used in your cool research project/ presentation.
5. (Optional) You tell your friends, colleagues about how cool we are.
Pricing
The pricing of projects depends on a number of factors:
1.The type of service provided (infographics/3D models)
2.The type of data (does it need a particular expertise/ software)
3.The amount of the data (Number of readings/Sample size/Pages of research)
4.The project timeline (is it urgent/long-term?)
Please fill out the online form in the contact section to get a approximation of the cost of your assignment.